Genetic Algorithm
finding extrema of a functions of two variables
Photo by Alexander Popov on Unsplash
This is my final project for Artificial Intelligence course from 4th semester (Summer Semester 2018/19), conducted in cooperation with Pawel.
For function parsing we used SymPy symbols and lambdify function which results then were computed using NumPy ndarrays.
PyQt5 as a GUI, Matplotlib as a data visualisation.
Features
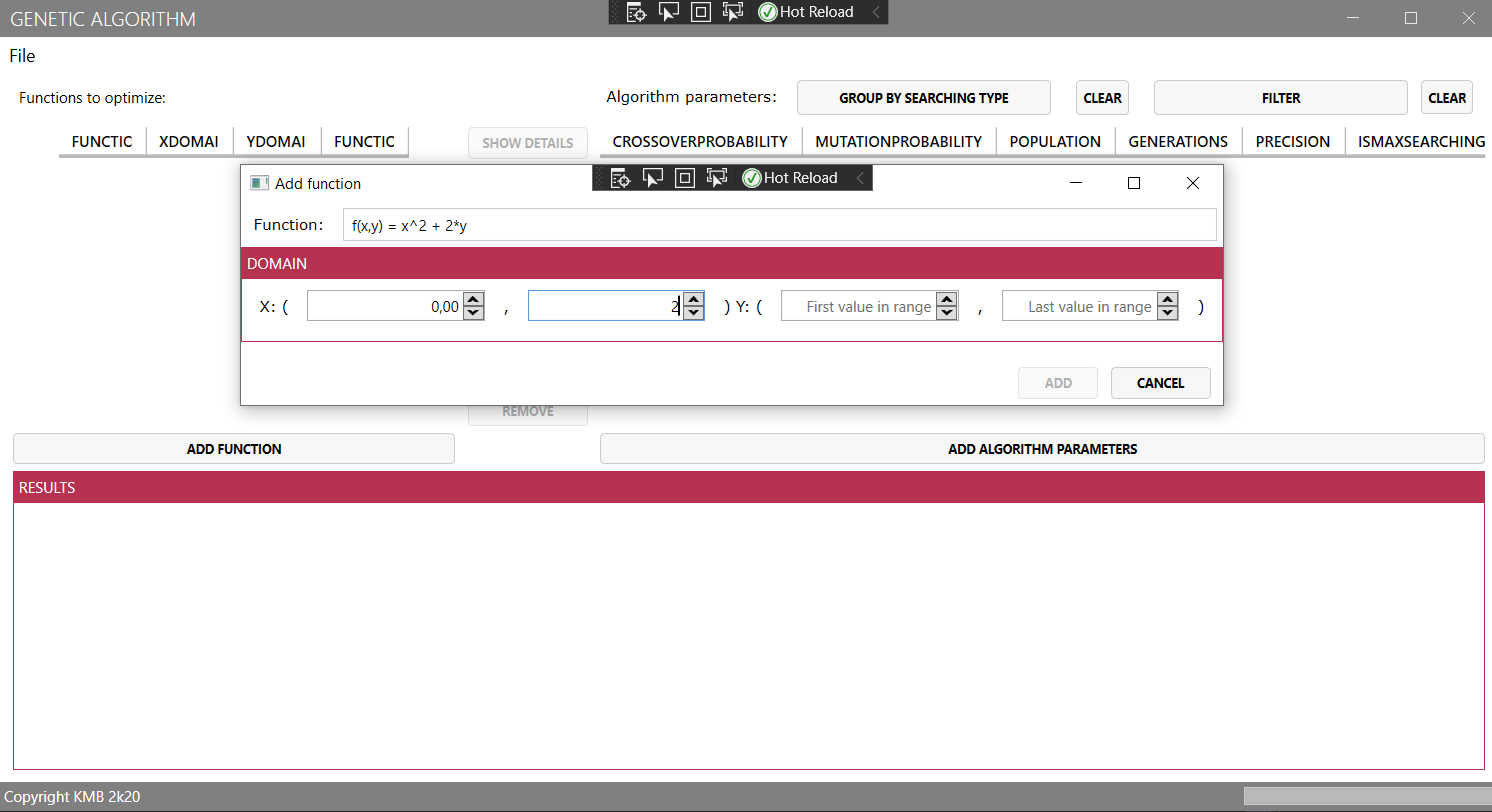
- Defining function of two variables, its domain and range
- Parsing function
- Function visualization in 3D with possibility to manipulate angles of a 3D object
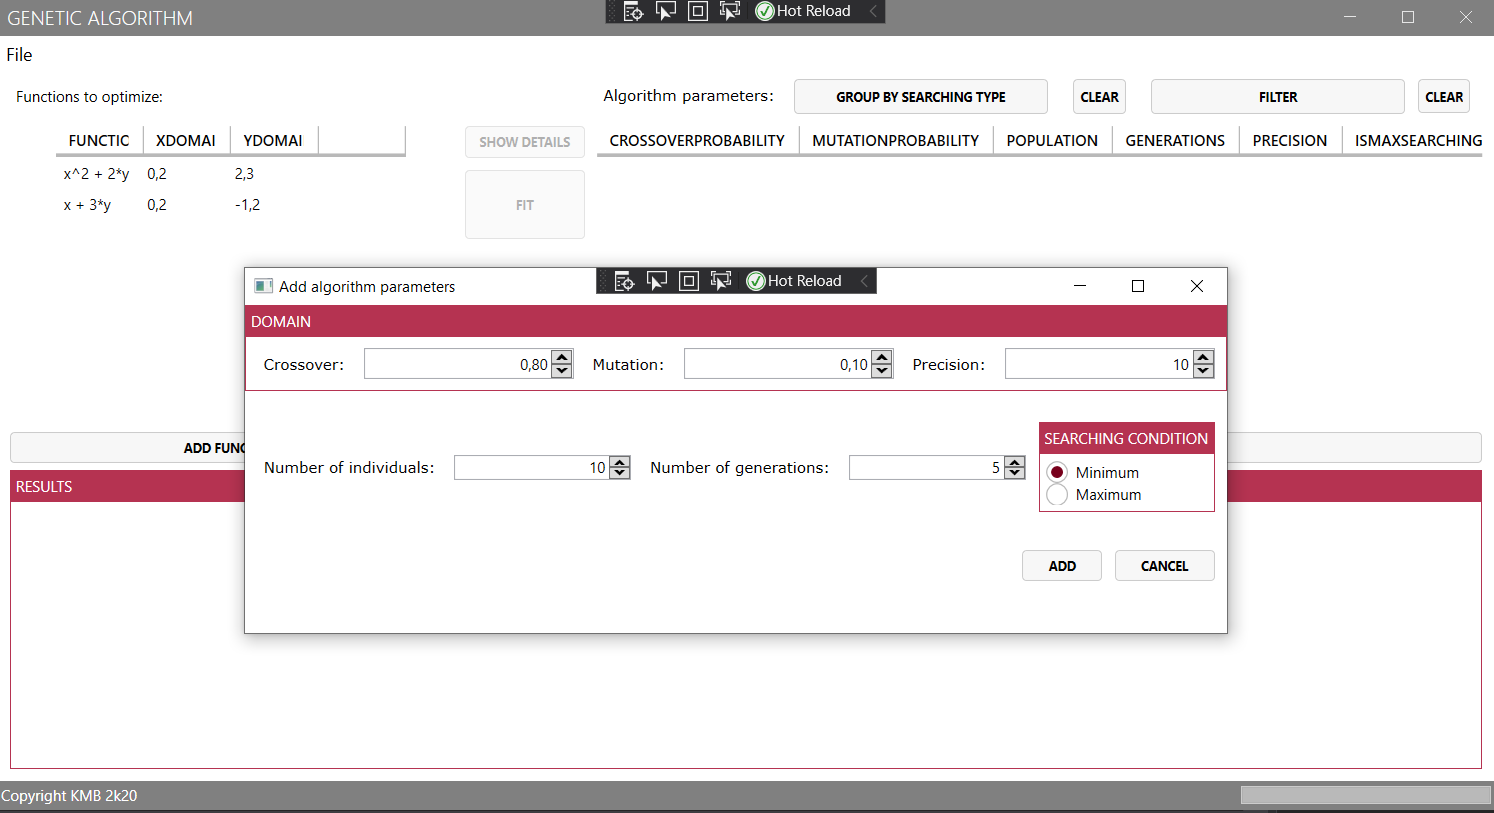
- Defining crossover, mutation probability, number of individuals and epochs in GA
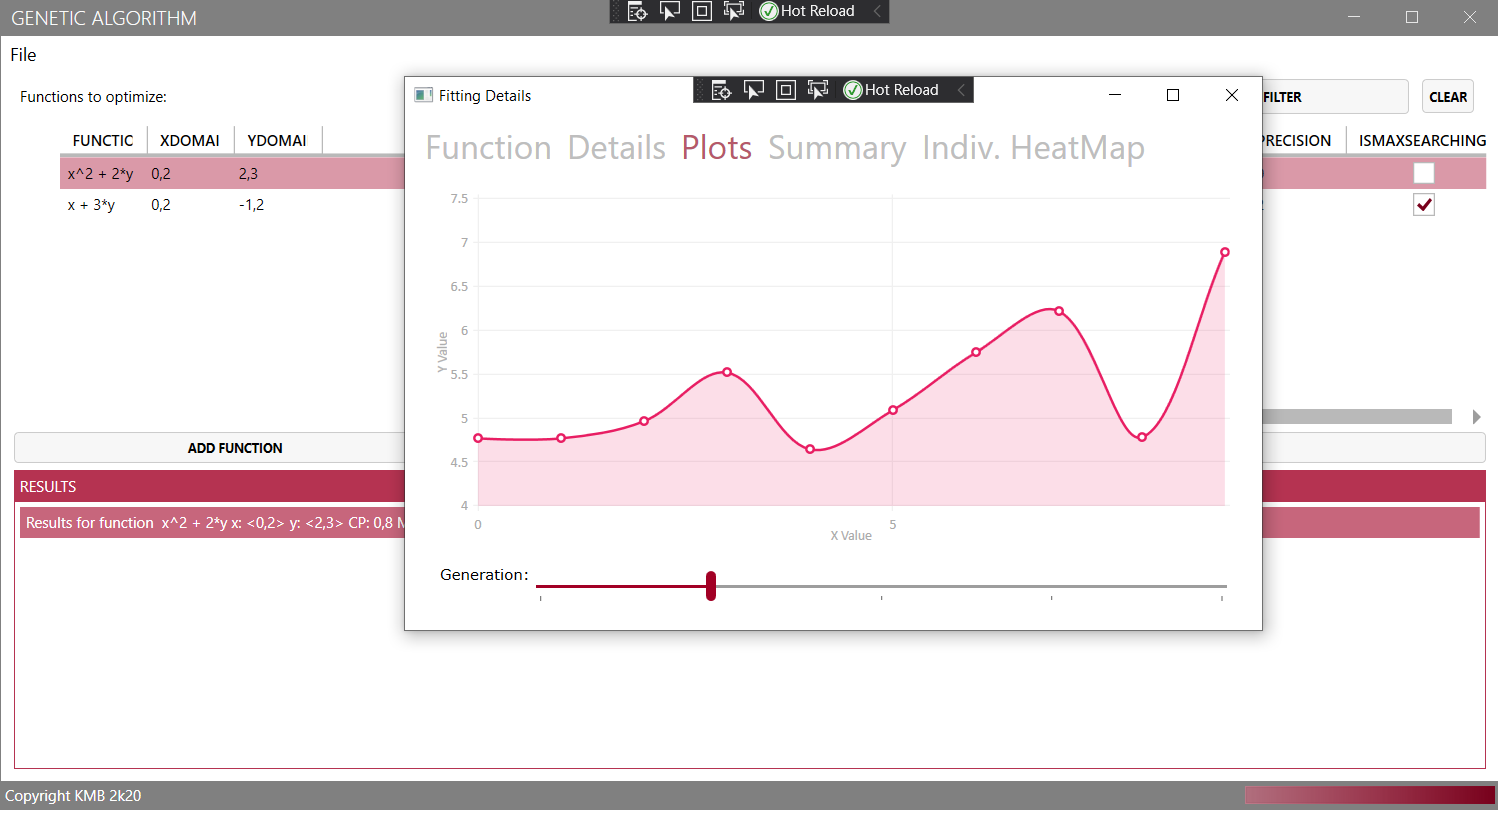
- Plot of each generation
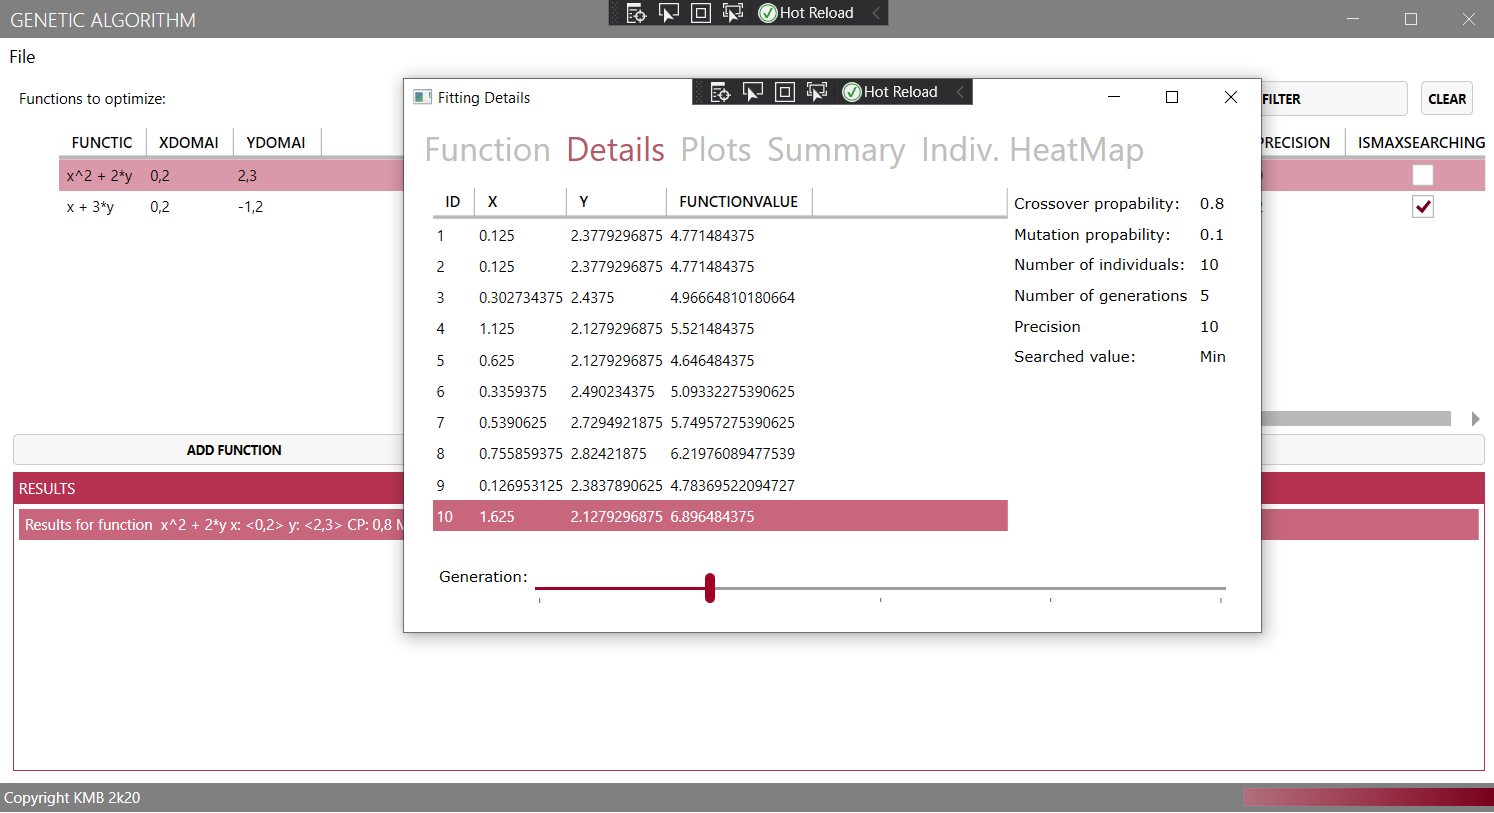
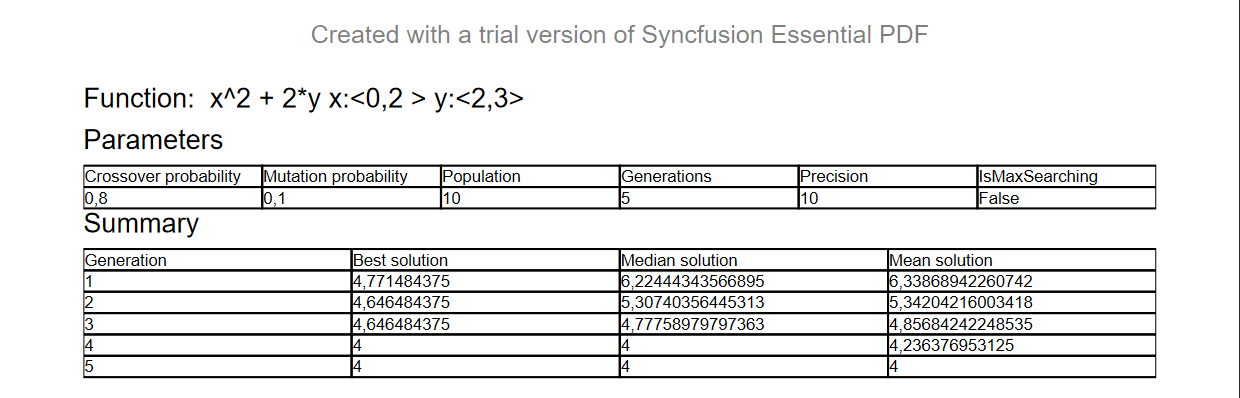
- Summary with chromosome which values will give the best solution
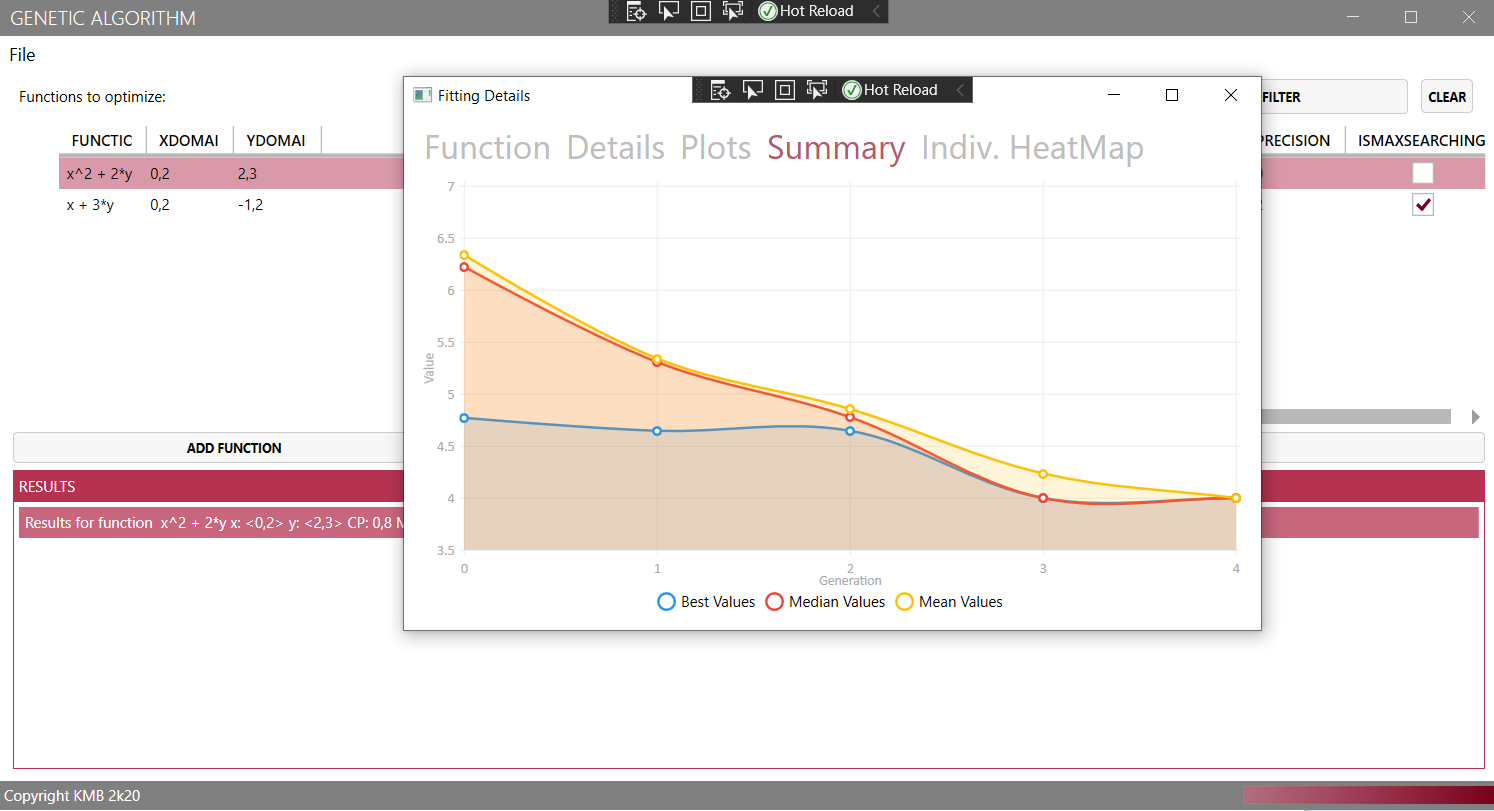
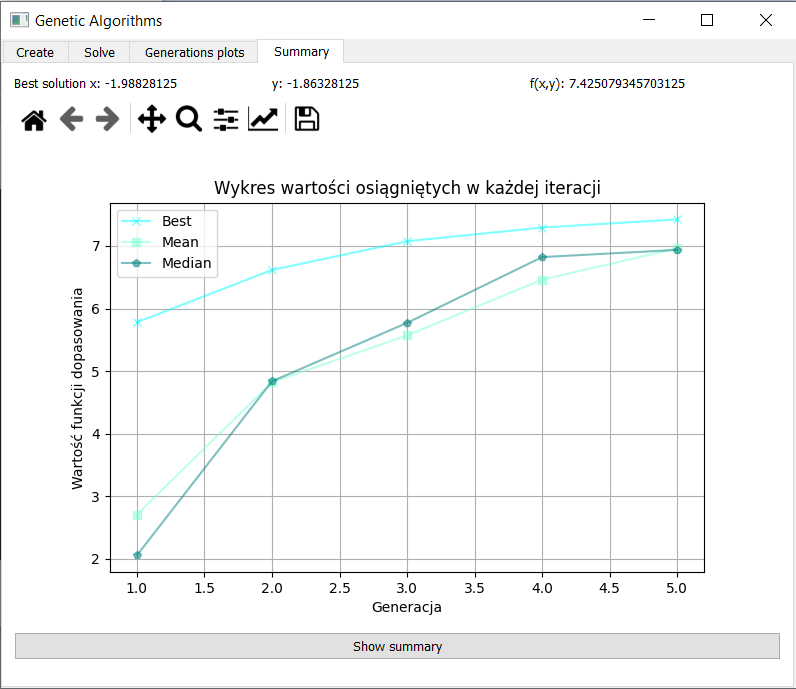
- Plot of best, median and mean value in each epoch
Screenshots
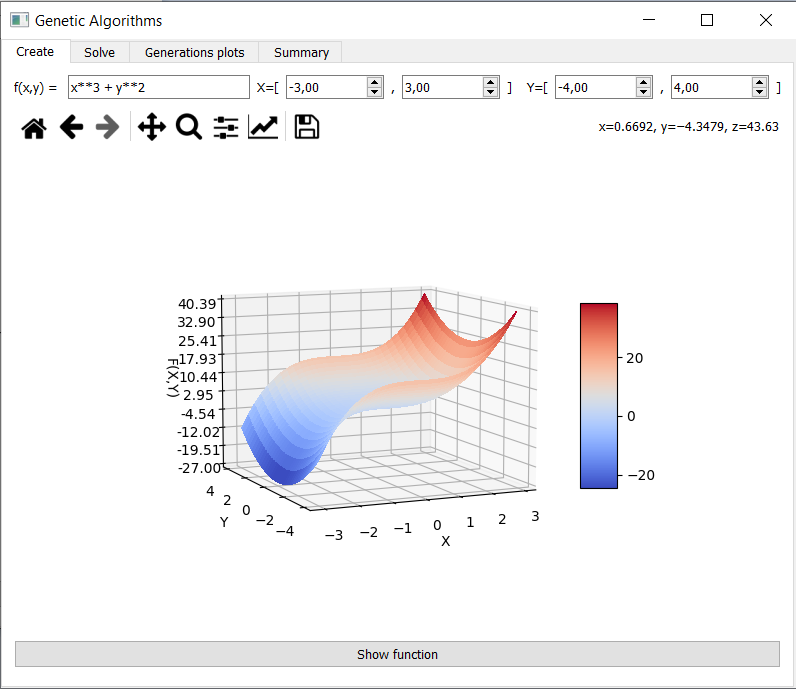
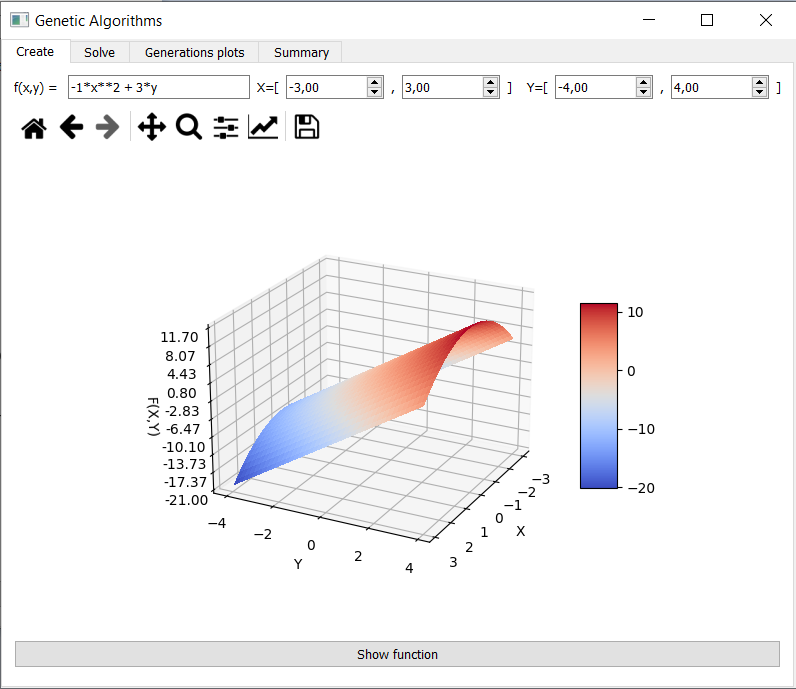
Functions visualization, setting function domain and range
\[x^2 + y^2; x \in \langle -2, 2 \rangle y \in \langle -2, 2 \rangle\]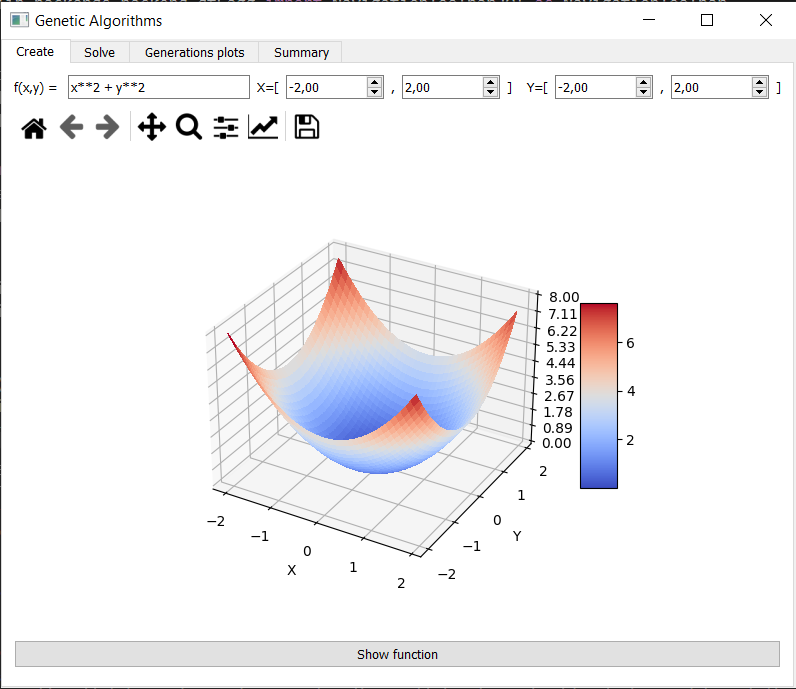
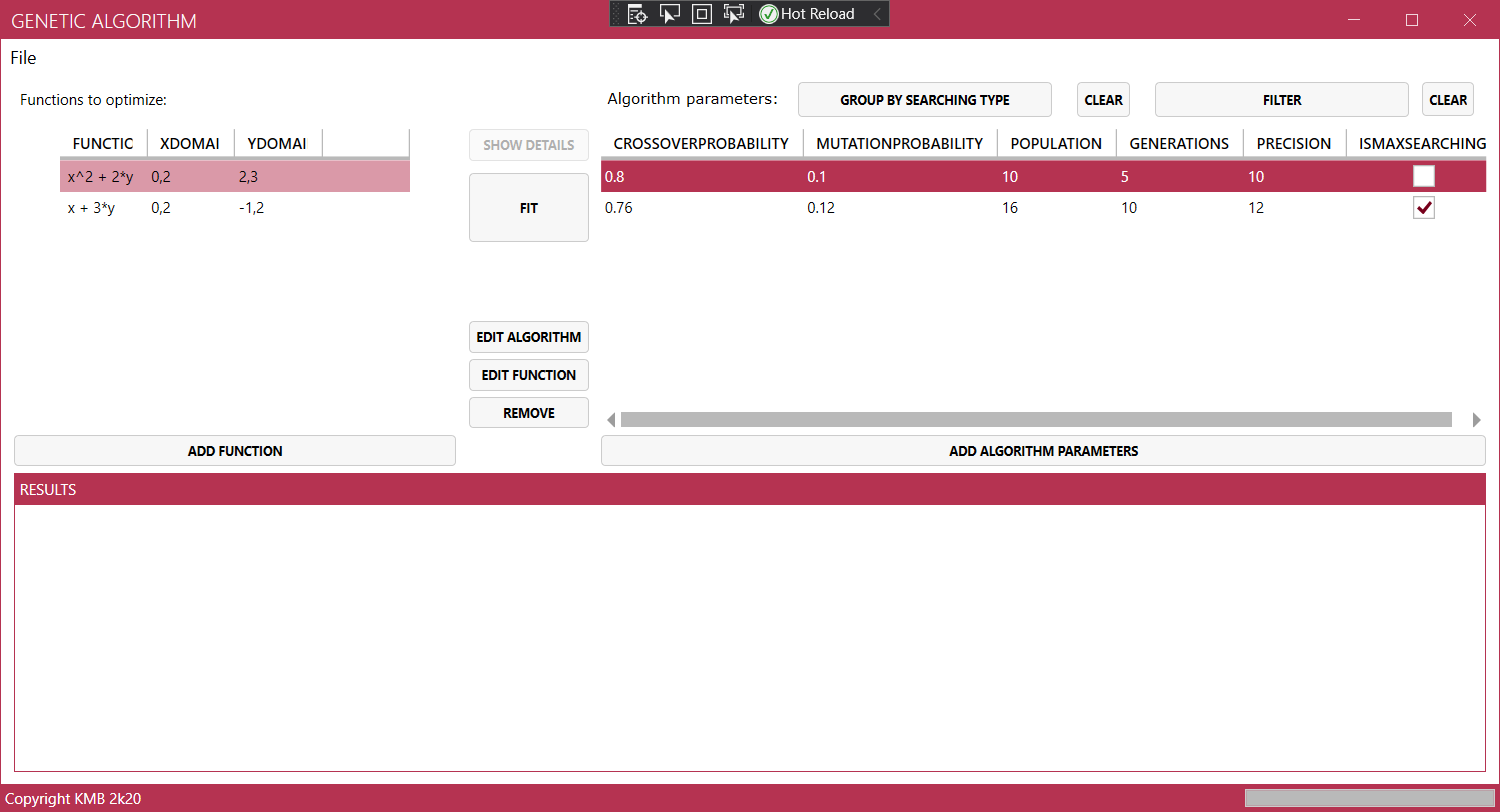
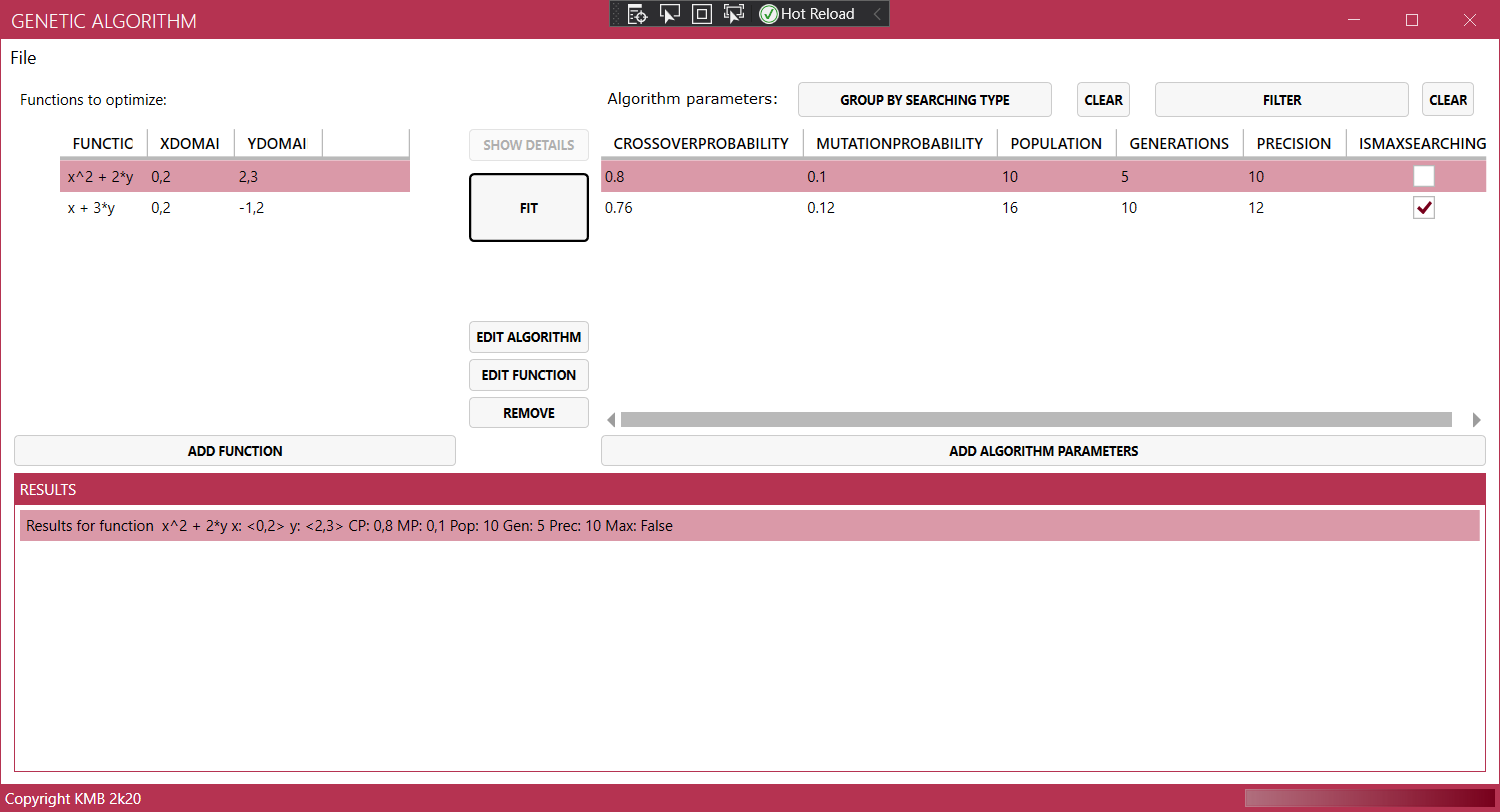
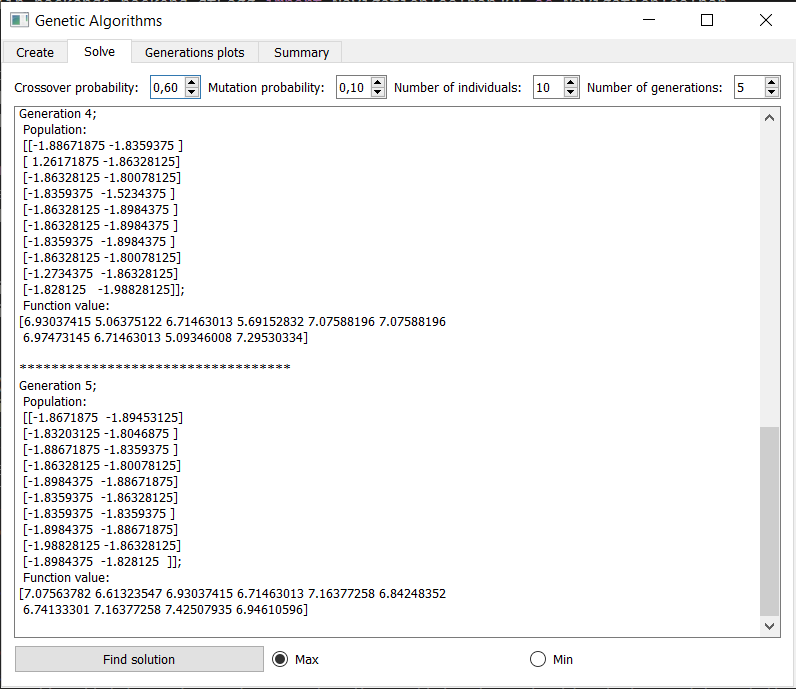
Solving genetic algorithm
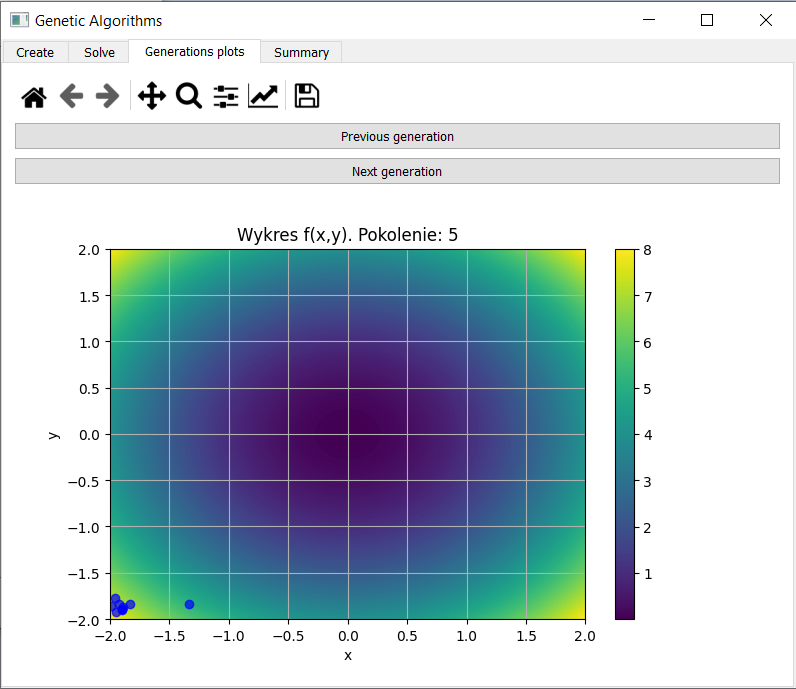
Generation plots

Summary
Remaster
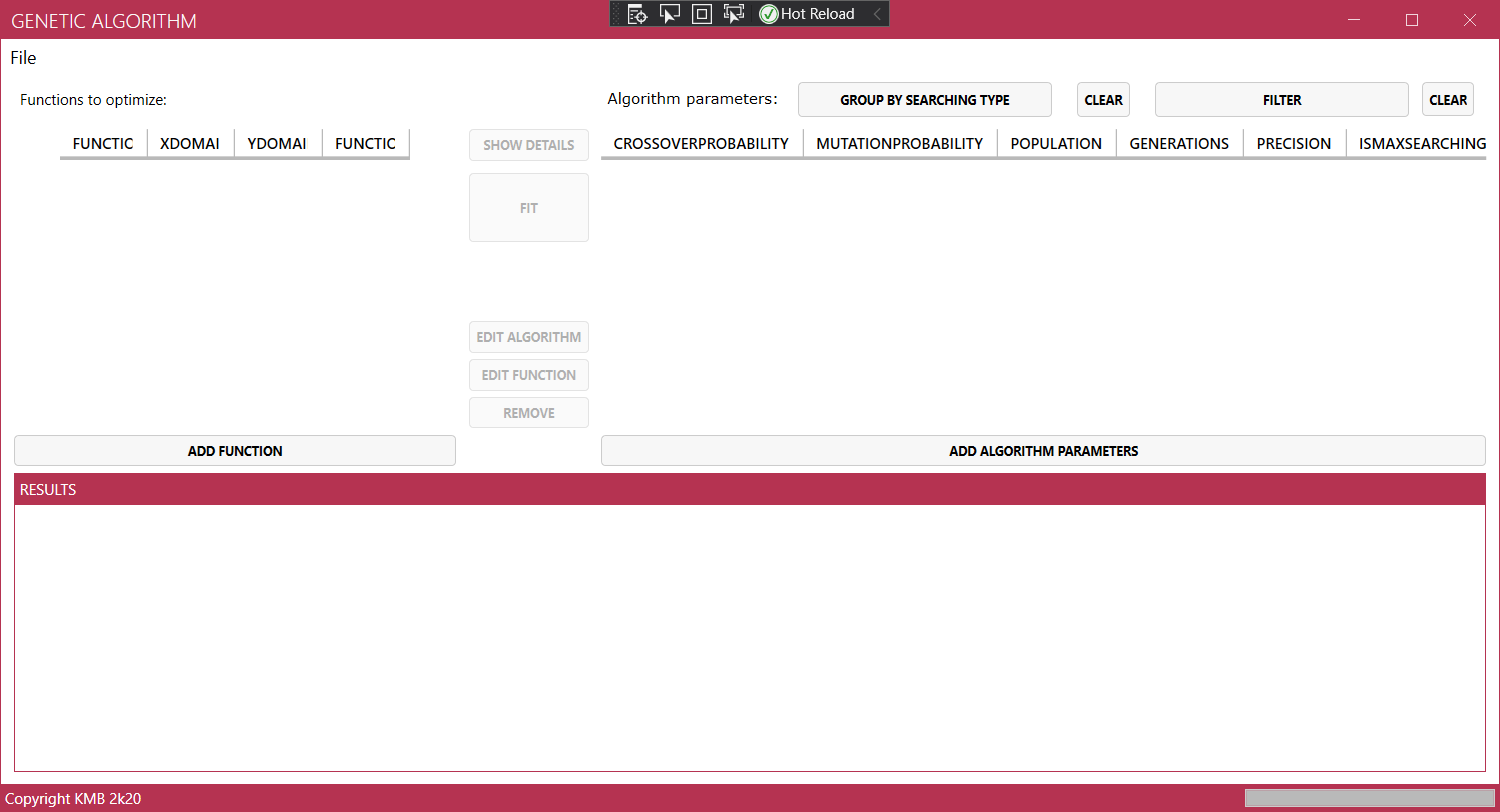
In 2019 Pawel and I decided to update this project further and with our colleague Daniel we created a new version for Building Desktop Applications using WPF course from 6th Semester (Summer Semester 2019/20). We rewrite whole project to C# and add additional featues such as:
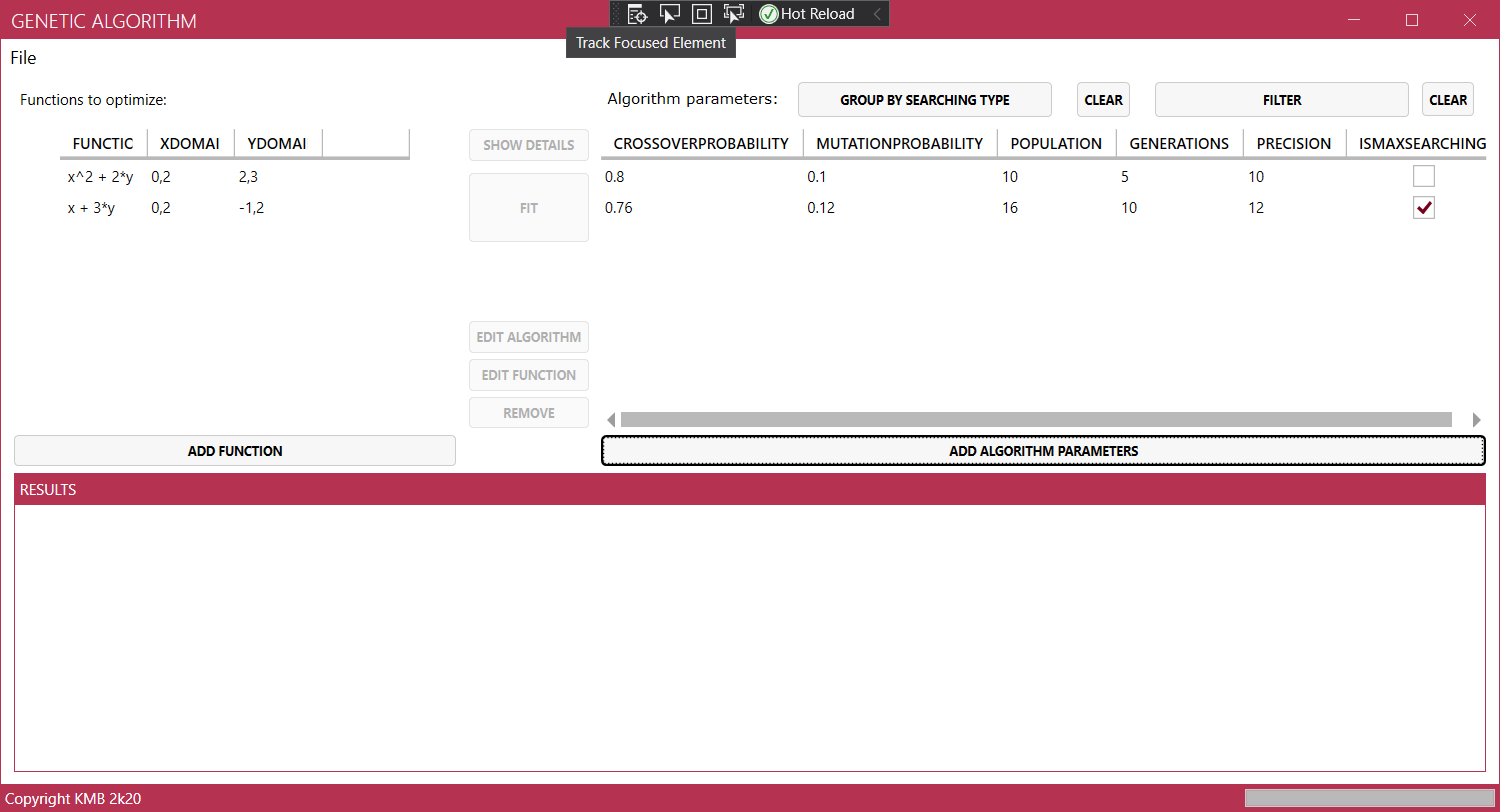
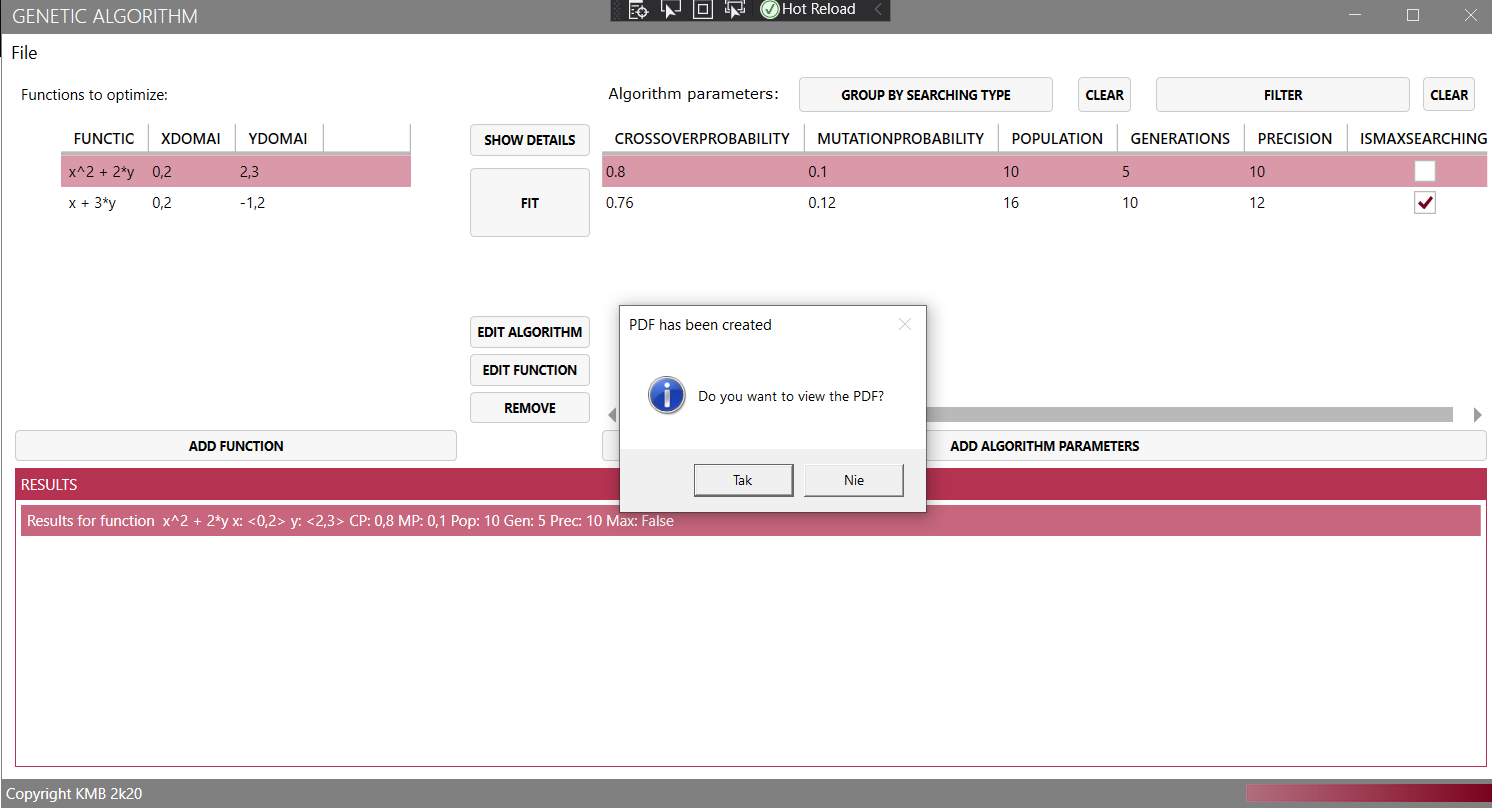
- now many functions with various algorithm parameters can be computed at the same time
- results can be exported to PDF file